Data Analysis & Quality Control

Excel is a popular tool for data analysis, especially among non-statisticians. This page lists some of the templates I've created over the years for performing some common tasks related to data analysis, Lean Six Sigma, quality control, and statistics. You may also want to see my article on Monte Carlo Simulation.
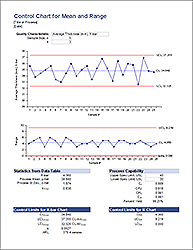
Although there are many Statistical Process Control (SPC) software tools available, many engineers (and dare I say statisticians?) still often cr[...]
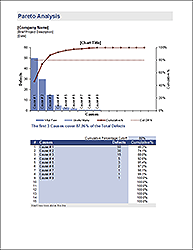
The Pareto Chart or Pareto Diagram, named after the famous economist Vilfredo Pareto (1848-1923), is a common tool for quality control[...]
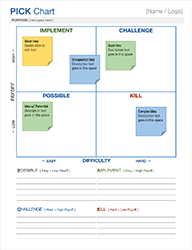
A PICK Chart is a very effective Lean Six Sigma tool used to categorize process improvement ideas after a brainstorm session. T[...]
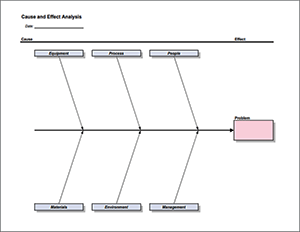
A Fishbone Diagram is another name for the Ishikawa Diagram or Cause and Effect Diagram. It gets its name from the fact that th[...]
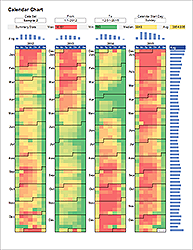
A calendar chart is a visualization that shows how a data set varies with the days, weeks and months of the year. One popular variant[...]
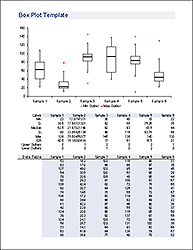
A box plot or box and whisker plot can be created in Excel using the new built-in Box and Whisker chart for Excel 2016 or later. To cr[...]
