Savings Calculator
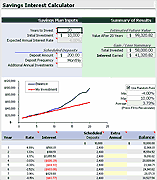
Our Savings Calculator is a free spreadsheet that is simple to use and much more powerful than most online calculators that you'll find. It will estimate the future value of your savings account with optional periodic deposits. It also includes a yearly table that lets you add specific annual deposits that may be different from year to year. You can also choose to randomize the annual interest rates within the Min/Max values you specify so you can get an idea of what a fluctuating market might do to your savings.
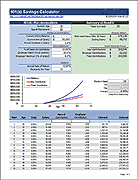
If you are comfortable with Excel, you can also use our Savings Calculator as a template and customize it to suit your own personal situation. We also have a 401(k) Savings Calculator designed specifically for estimating the future value of a 401(k) savings account. Try the Annuity Calculator if you are trying to figure out how much you may need at retirement.
Savings Calculator
for Excel and OpenOffice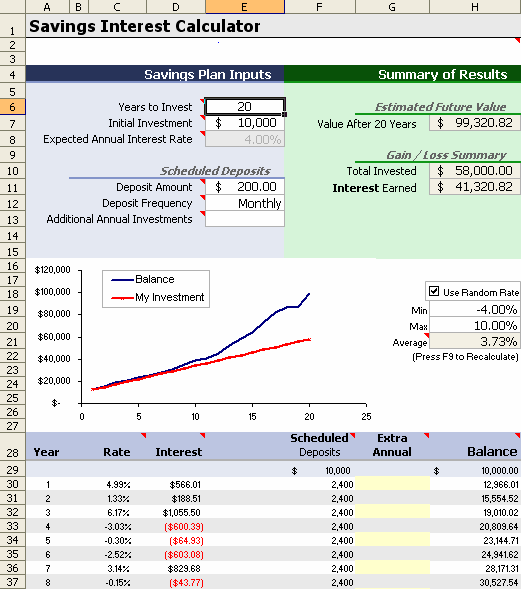
Description
Estimate the interest earned in your savings account. Include regular monthly deposits and/or an annual deposit. This simple to use Excel spreadsheet includes a table showing the interest earned each year.
A unique feature of this calculator is the option to select a random interest rate, to simulate fluctuation in the market. Just press F9 a bunch of times to see how the graph of the balance changes.
The versions for OpenOffice and Google Spreadsheets were created using the simpler version of the calculator shown on the left. It doesn't include the random interest rate feature, but you can manually enter different rates for each year in the interest rate column.
Using the Savings Calculator
Example: Let's say I start with $2500 in a savings account with a 4.0% annual interest rate (perhaps a CD or money market). I plan to deposit $100 per month. I also want to deposit my tax return, but that will change from year to year. I'm pretty sure that my tax return will be at least $1000 so I enter that in the Additional Annual Investments field. The screenshot below shows that my estimated savings balance after 30 years is about $134,500.

In the graph, the interest earned is the difference between the End Balance (blue line) and the Cumulative Interest (magenta line). The graph shows that until about 10 years, the majority of the balance is the cumulative amount I've invested rather than interest earned. But, by the end of the 30 years, my balance is almost twice what I put in.

