Timeline Templates for Excel
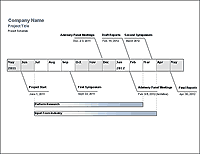
A timeline can be a useful way to visualize changes or events that occur over periods of time. Excel can be a great tool for creating timelines, particularly when you want to perform date calculations or take advantage of the drawing tools in Excel. See below for some example timeline templates to help you get started.
Common Uses for Timelines
- Display a project schedule.
- Deliverable dates - Milestones - Task completion - - Chronologically arrange past events.
- Innovations in science between 1800 and 2000 - World history - - Represent a person's life history.
- Depiction of life events along with historical time periods or local events - - Map historic events and time periods.
- History of the universe - Theory of evolution - Geologic time -
Example Timeline Spreadsheets
 Project Timeline / Schedule ▶
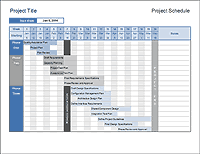
This project schedule template can be used for creating nice looking project timelines. It is very similar to a gantt chart but it doesn't have all the features that a typical gantt chart would have.
Vertical Timeline Using Shape Objects
for ExcelAuthor: Jon Wittwer
Description
I like using Excel has a drawing canvas, especially for timelines, because the canvas is nearly infinite in size. A vertical timeline is easy to create using shape objects (lines, text boxes, callouts, etc.). You can use this template to give you a head start. Format a shape or callout the way you want and then use copy/paste to duplicate the shape and add your events.

View Screenshot
Project Timeline via Drawing Tools
A Gantt chart is typically used in business and engineering to plan and schedule projects. If you need a special format for a project timeline, you can create one using the drawing tools in Excel. This spreadsheet below contains two example project schedules.

View Screenshot
Time Period Comparisons
In history and genealogical research, timelines are particularly useful for comparing events and people's life spans. This example spreadsheet uses stacked bar charts to compare a few different people living before and during the civil war. If you do genealogy research, you may want to try the Family Tree Template, also.
Automated Timeline Templates

Vertical Bubble Chart Timeline

Horizontal Bubble Chart Timeline
Bubble Chart Timeline Template ▶
(For Excel 2013+) Learn how to create a timeline using a Bubble Chart! The axis labels can be customized easily and the bubbles for the axis and timeline events can be different sizes.
 Excel Timeline Template ▶
Create a historical or project timeline quickly and easily using this original TotalSheets timeline template. This page was originally an article explaining how to create a timeline using an XY chart and error bars for leaderlines, but now you can download the time line template and get a huge head start on your project!
 Vertical Timeline ▶
Create a dynamic vertical timeline in Excel using a scatter chart, data labels, and leader lines. Download the template or follow the instructions to create the timeline from scratch.
 Google Sheets Timeline Template ▶
Create a horizontal or vertical timeline in Google Sheets using a scatter chart and data labels.
 Project Timeline Template ▶
Create a project timeline in Excel using a stacked bar graph and different colors for different phases or categories. Great for high-level project timelines.
 Project Timeline Chart ▶
Create a project timeline showing both milestones and tasks, using a scatter chart with data labels and leader lines.
References
- Create a Timeline in Excel - TotalSheets.com - This is my article about various techniques for creating timelines using Excel.
- Make a Timeline Using SmartArt graphics - support.microsoft.com - I haven't tried this approach yet, but it looks interesting.


