Organizational Chart Template
Need to create an organizational chart for your company? Have you considered using Excel instead of PowerPoint or some other organizational flow chart software? Read through to the end of this page to see why you might want to use a spreadsheet to create your company's organization chart. All of the org chart templates created by TotalSheets on this page can be downloaded for free. We've also listed other non-free resources.
Company Organization Chart Template
for Excel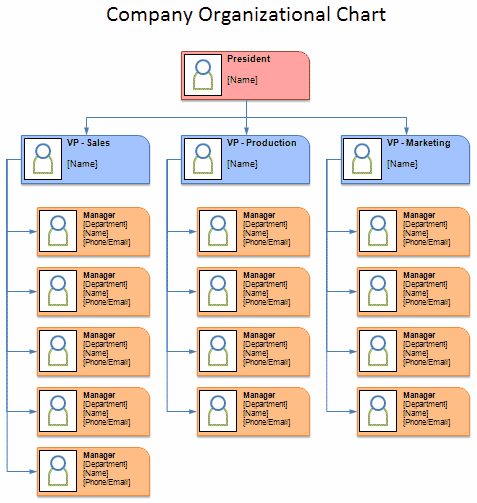
Description
This template uses basic shape objects and lines to create an org chart. To add photos, delete the placeholder image and go to Insert > Pictures, then resize and crop the image as needed. The template contains an additional worksheet without placeholders for photos.
Department Org Chart Template
for Excel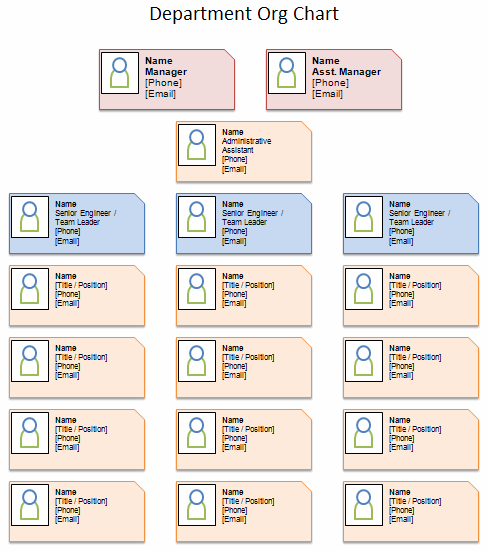
Description
This template uses simple shape objects to show the organizational structure of a department consisting of a manager, assistants, team leaders, and team members. Lines are not always needed, especially if the structure is clear from the positioning of the roles within the chart.
Nonprofit Organization Chart Template
for Excel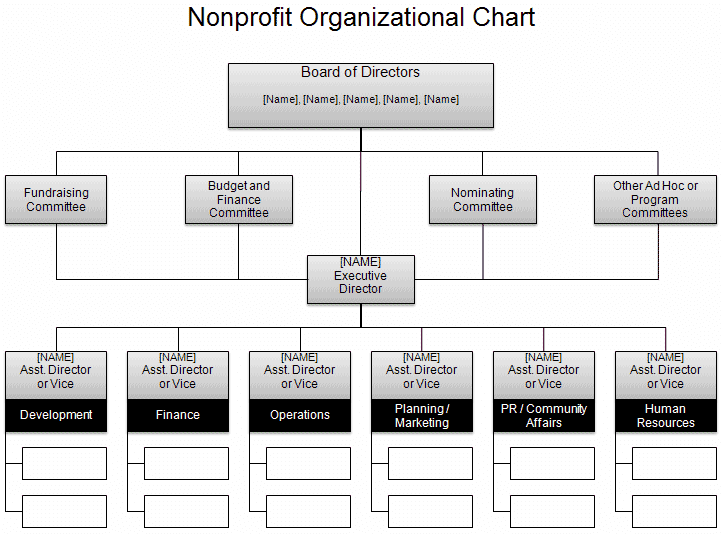
Description
A sample organizational chart for a nonprofit organization, created using basic shape objects and connector lines in Excel.
School Organizational Chart
for Excel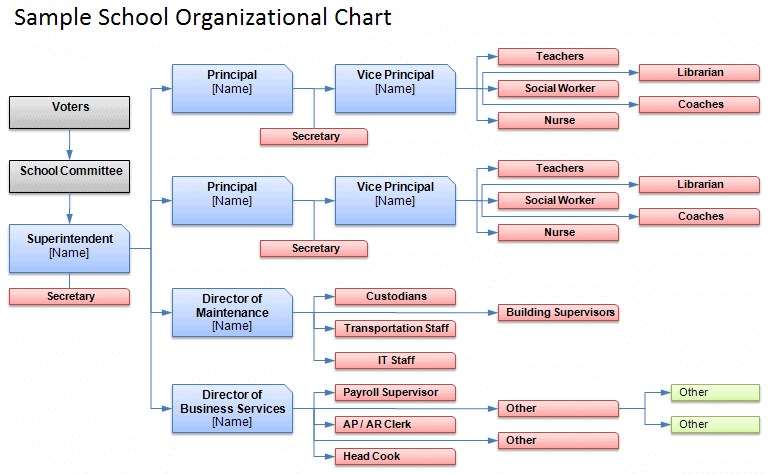
Description
Three different sample school organizational charts on separate worksheets, created using basic shape objects and connector lines.
Matrix Organizational Structure Chart
for Excel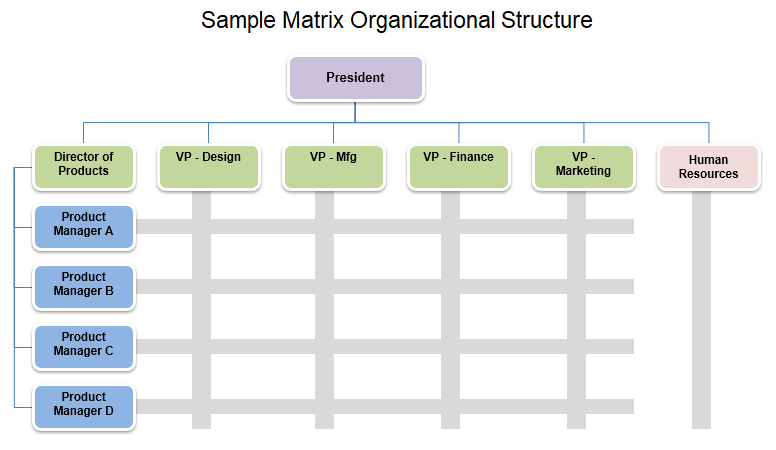
Description
A matrix organizational structure attempts to combine both vertical and horizontal structure and results in workers reporting to more than one manager. For example, one manager might be in charge of many engineers, but those engineers may work on different projects and therefore report to their product managers as well.
Functional Organizational Structure Chart
for Excel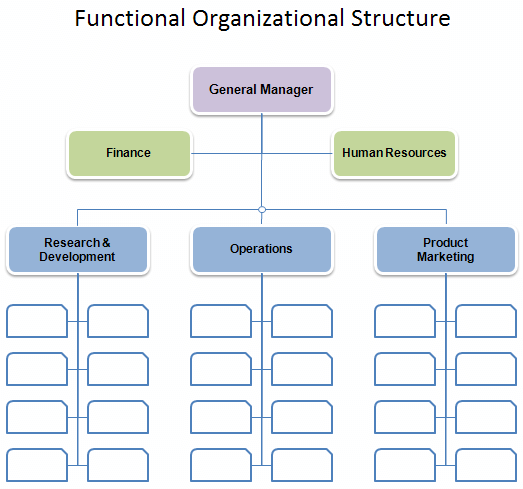
Description
A functional organizational structure groups workers based on the type of work or skill (such as finance, sales, IT, customer service, research, etc.), with each silo having its own vertical hierarchy.
Divisional Organizational Structure Chart
for Excel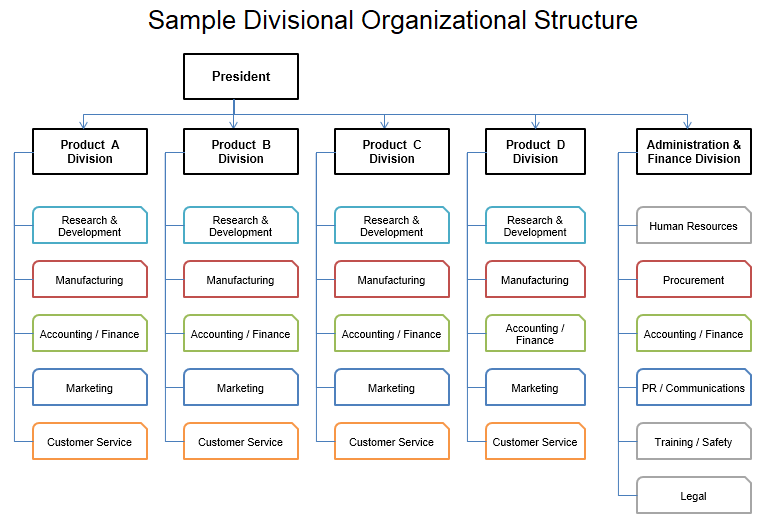
Description
A divisional organizational structure is generally based on different geographic regions, markets, or product and service lines. This is particularly common in large corporations.
Horizontal Organizational Structure Chart
for Excel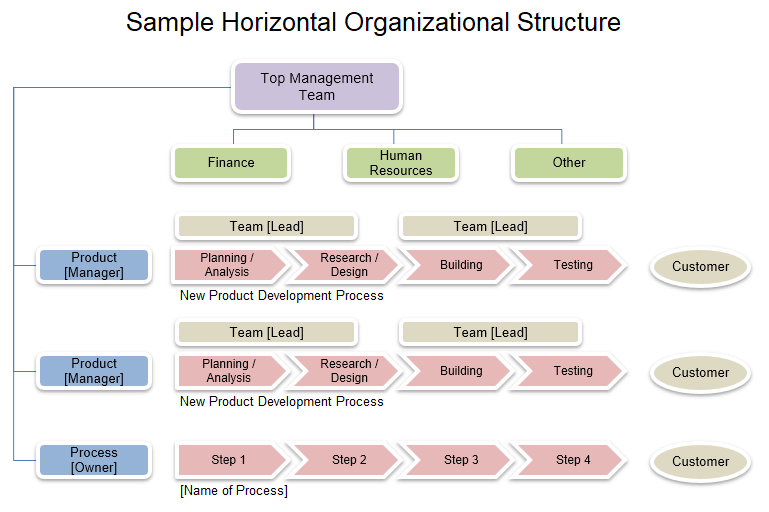
Description
This type or organizational structure has fewer levels of middle management (less vertical hierarchy). An org chart for horizontal structure might focus more on product, process, and communication rather than on chain-of-command. This example shows the product cycle as well as team leads and product managers.
How to Create an Organizational Chart in Excel
If you've created an organizational flow chart or other types of flow charts using PowerPoint, you probably know how frustrating it can be to constantly move around, resize, and align various blocks. But, did you know that Excel also has some of the same Drawing tools as PowerPoint and Word? Not only do you have access to the same set of tools, but take a look at the following reasons to use Excel:
Why use Excel to create a Company Organization Chart?
- You can create a very large organizational chart and then use the print settings to fit the entire org chart onto a single page. Trying to fit a large flow chart on a single PowerPoint slide is harder because you have to play with fonts and it's harder to scroll around on the page when you have it zoomed up.
- It is very simple to align blocks of information either in columns or rows. Think of the spreadsheet grid as your "drawing grid". You can use drawing guides and turn on a grid in PowerPoint, but it's not as easy as using the grid in Excel.
- You can resize an entire row or column of blocks in your organization chart by just resizing the row or column. By default, Autoshapes in Excel move and resize with the cells.
Inserting AutoShapes and Connector Lines
When it comes to creating flow charts and diagrams, Excel is great! Not only do you have many rectangular shapes available to you (various types of rounded and chamfered corners), but it is also extremely easy to add color, gradients, and shading to the blocks of your organization chart by just selecting formats from the gallery of themes.
To help you get started, follow these steps:
- Go to Insert > Shapes and choose one of the rectangular shapes.
- Click on the rectangle you just inserted. A contextual ribbon is then displayed which will allow you to select a ready-made format.
- To add a connector line, go to Insert > Shapes and choose one of the Connector objects. Tip: If you click on a connector line and the end shows a red bubble - that means it is connected to the other object.
Tip: To align the blocks of the org chart to the spreadsheet's grid, hold down the ALT key as you draw or resize the Shapes. The Alt key causes the Shapes to snap to the corners and edges of the grid.

